Displaying data within the browser
Selecting tracks to display
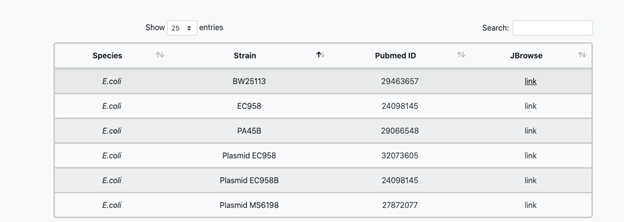
To access the browser, click the link from the home page next to the library of interest. This will open up the browser, with the genome and annotated genes pre-loaded, in addition to all the available ‘combined’ datasets for that library.
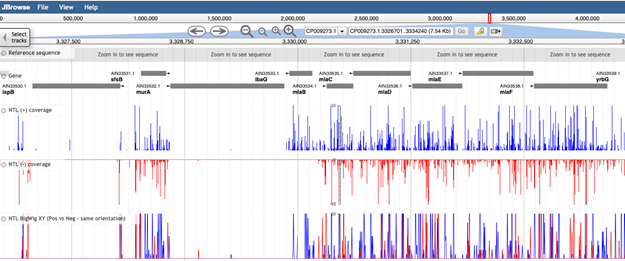
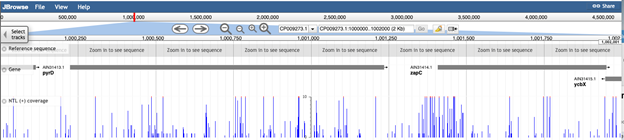
The default settings are to display the genome sequence at the top (A), which becomes visible as you zoom in, the annotated genes below in grey (B) and the insertion data below the genes (C, D and E)
![]()
![]()
![]()
![]()
![]()
Use the navigation bar at the top to browse the genome
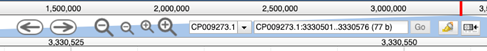
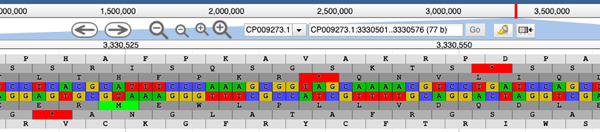
The arrows will pan the field of view left or right, and the magnifying-glass icons can be used to zoom in and out of the data. At maximum zoom, the genome track displays the nucleotide sequence, and corresponding protein coding sequence. Stop codons are depicted by an asterisk, and coloured red.
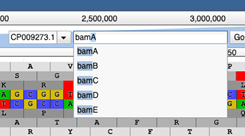
To navigate to a specific region of the genome, use the search bar at the top of the page. You can search by gene name: as you begin typing, autocomplete will prompt the possible available options. Please note that an incomplete gene name will not return a result, for example typing “bam” and hitting enter will not navigate to any of the bam genes, you must specify the complete gene name. Searching by gene name is not case sensitive.
You can also specify a specific nucleotide position to navigate to, for example typing 2,000,000 will centre the page on the 2,000,000th nucleotide, at full zoom. You can also navigate to a defined range, for example typing 1..1000 in the search bar will display nucleotides 1-1000.
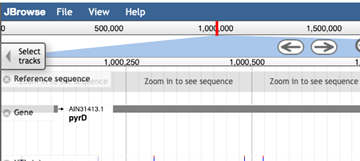
If you are unsure of your location in the genome, this is displayed both in the search bar, and highlighted in red at the top of the page.
>
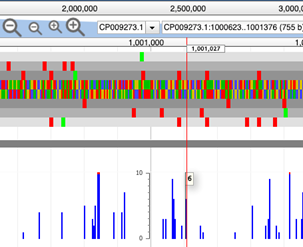
At full zoom, hovering over the nucleotide numbering track will display a vertical, hovering red line, you can use this to identify the precise position of each insertion site. Hovering over an individual peak will display the frequency (or read depth) of a given insertion event.
To determine the nucleotide position of a given insertion, hovering over the browser tracks will prompt a vertical red line to appear which moves with the cursor. If you hover over a specific peak, this will display both the nucleotide position of that peak, and the frequency (read depth) of transposon-sequencing reads that map to that position.
To change the tracks displayed in the browser, click ‘Select tracks’.
This will load the data table that holds any meta data for the library and available tracks. To change the display, select the tick box next to the corresponding entry.
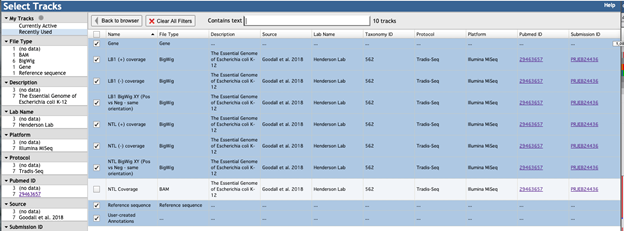
Tracks display in the browser in the order they are selected. Track options include the reference sequence (File type: Reference sequence), gene annotations (File type: Gene) and the insertion data (File type; BigWig).
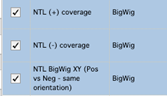
There are two
display options for visualising the insertion data, depending on your interests
and preferences. Each insertion dataset can be displayed either as a single
track of the total data (“Pos vs Neg – same orientation”), 
Or as two tracks, displaying the exact same information but separated based on the orientation of the transposon at the point of insertion (denoted 'pos' and 'neg' corresponding with the strand of the reference genome the raw data maps to).
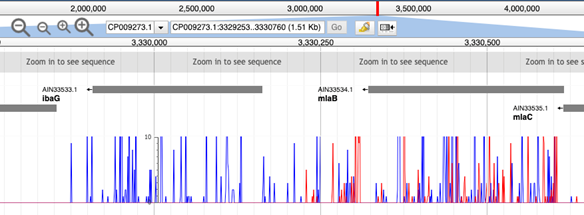
The ‘combined’ dataset presents the data in a single track, oriented above the track origin, with the ‘pos’ and ‘neg’ outputs distinguishable by colour.
Whereas the individual tracks display the data in opposing orientations:
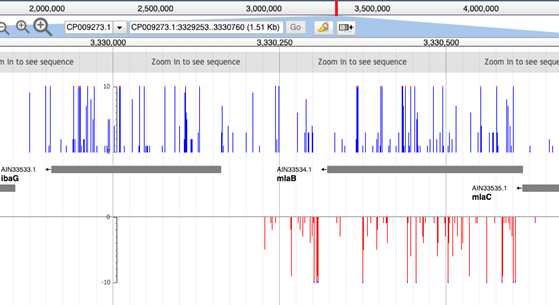
This can be useful if you have data where there is clear insertion bias.
You can select up to 32 tracks to display at once.